Analytics · Conversion tracking · Reporting
PI Startup Website Reporting & Analytics Setup
A GA4, Google Tag Manager and Looker Studio reporting layer built for a multi-site B2B group, so form submissions and CTA clicks could be measured instead of inferred.
Results at a glance
- Measurement layer
- GA4 + GTM
- Conversion events
- Form + CTA
- Reporting
- Looker Studio
- Form types audited
- 4
Rebuilt and validated
Submissions and clicks
Shared stakeholder view
Contact and service forms
The problem
The group had SEO work running across several domains, but the reporting layer could not answer a basic question: which pages and forms were producing enquiries? Form submissions were not consistently captured as conversions, and reporting was assembled from screenshots taken in different tools.
That made the work harder to judge. A technical fix or a rewritten page could ship, but there was no reliable way to tell whether it changed enquiry behaviour rather than just moving traffic.
Why we decided to solve it
Rankings and sessions are intermediate signals. For a B2B company-formation business, the useful question is whether a page produces a form submission or a meaningful click.
Without event tracking, the team could improve a page and still not know what happened next. A shared dashboard also reduced the reporting overhead: one definition of a conversion, one place to check it, and one baseline for every release.
How we did it
Audit the forms and events
I built a forms sheet, audited four form types and mapped which actions should count as conversions. That defined the data layer before any tag was changed.
Rebuild GTM from scratch
The Google Tag Manager container was rebuilt with a GA4 configuration tag, form_title and form_id data-layer variables, a wpcf7mailsent listener, a form_submit event and the matching GA4 event tag. I added the custom dimensions needed to separate forms and marked the actions that mattered as conversions.
The setup was validated in GTM Preview and GA4 DebugView rather than assumed to work after publishing.
Build the reporting layer
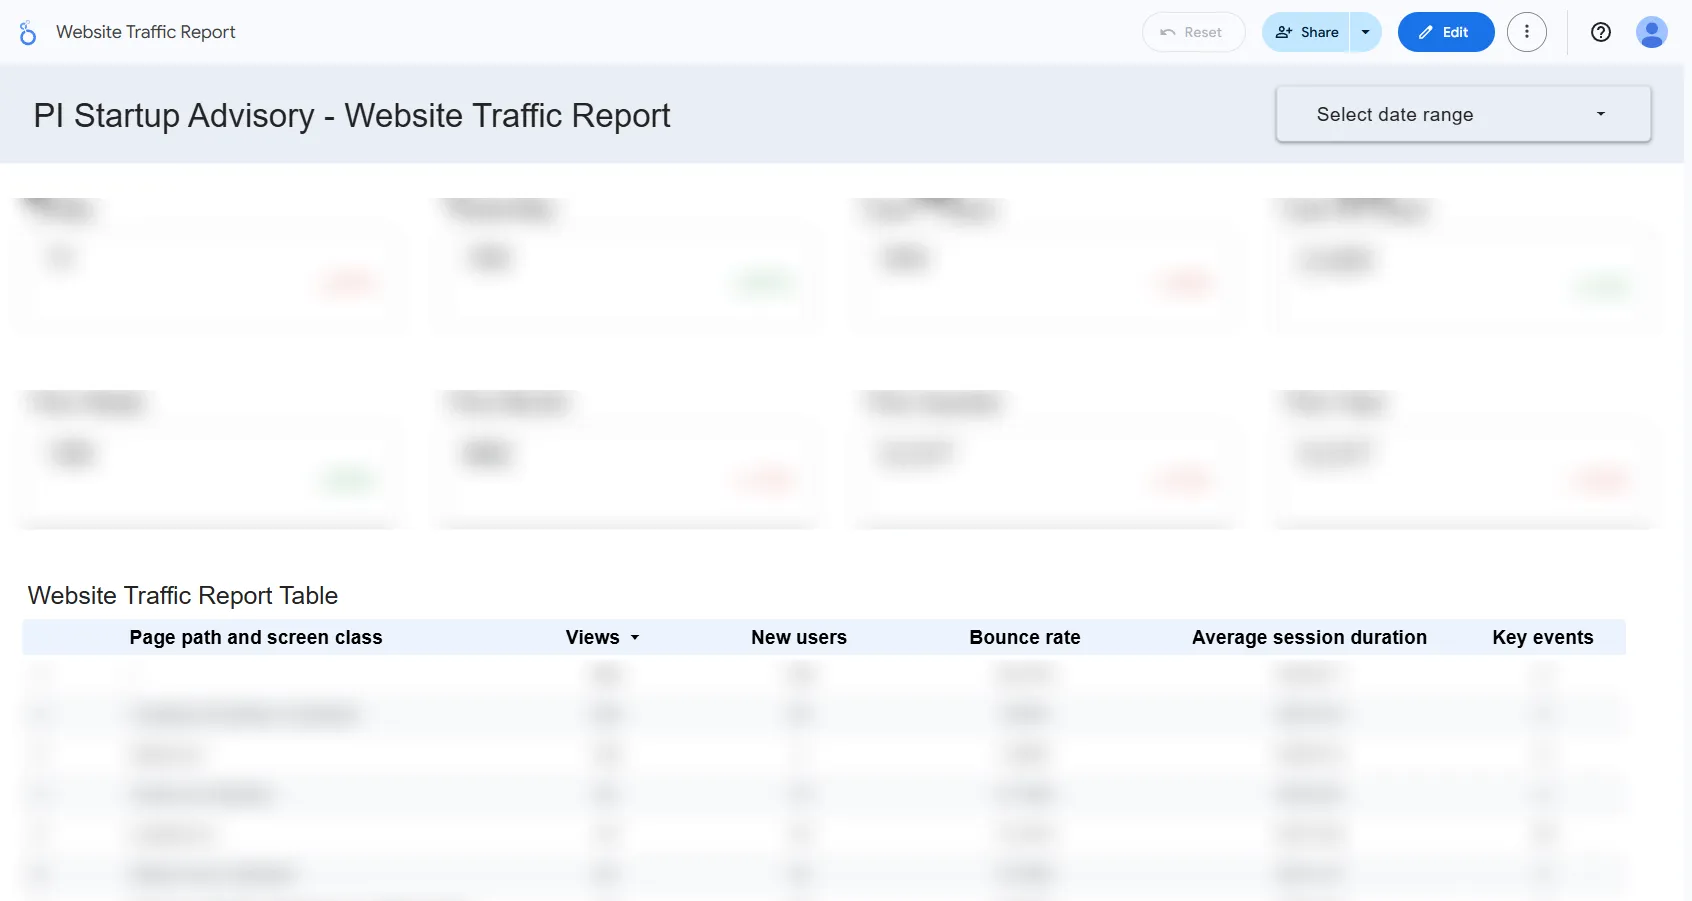
GA4 and a Looker Studio dashboard were configured to report organic sessions, channels and conversion events in one place. The dashboard was built as a reusable report, not a one-off export, so each release could be compared against the same definitions.
The result
Form submissions and CTA clicks became measurable, and the team had one shared place to check them. Reporting moved from ad-hoc screenshots to a repeatable dashboard that could be compared after each release. That made it easier to judge technical and content work against enquiry behaviour rather than traffic alone.
No traffic or conversion figures are published here: the account data belongs to the client. The screenshot shows the report structure with every data region blurred, which demonstrates the deliverable without exposing the account.
Evidence
What the work looked like.
Captures from the engagement. Images marked as redacted have sensitive business data blurred before publication.
Contact
Want to talk through a project like this?
I am open to remote SEO, web design and performance roles. If you need more detail on a specific project, ask — I will share what the client allows.
- [email protected]
- Phone
- +92 322 6189669
- Location
- Multan, Pakistan · Remote
- Status
- Open to remote roles